Why Is Data Visualization Important For Your Business?
Data visualization is one of the most powerful tools to support decision-making. By transforming complex data into visually engaging and easily interpretable charts, graphs, and infographics, data visualization empowers you to gain valuable insights and drive informed decision-making.
Whether you’re analyzing sales trends, customer behavior, market research, or financial performance, data visualization allows you to uncover patterns, spot outliers, and identify key trends at a glance. Shall we have a look at what is data visualization and how it can help your business grow?

Let’s Define Data Visualization
The company behind Tableau, a data visualization software, defines data visualization as a “graphical representation of information and data,” and they are right! It is simply the process of presenting data and information in visual formats. It serves as a bridge between data analysis and decision-making, empowering decision-makers to extract actionable insights from large data sets.
What Are the Advantages Of Data Visualization?
In our visually-oriented world, humans are naturally drawn to images, drawings, and colors. We are visual creatures, and our brains are wired to process and interpret visual information more effectively than text or numbers alone. Thanks to our natural inclination towards visuals, data visualization comes with a variety of benefits that make it easier for us to grasp, analyze, and share intricate information.
Some of the advantages of data visualization are:
- Support Decision-Making
- Accurate Sentiment Analysis
- Simplify Communication
- Empower Collaboration
- Improve Accuracy
- Improved Data Governance and Security
It is also worth mentioning that data visualization, while extremely useful, should be used judiciously. You should select appropriate visual representations that align with the data and intended message, ensuring that the visuals improve understanding rather than confuse or mislead the audience. It is also crucial to maintain data accuracy and integrity throughout the visualization process, avoiding any distortion or misrepresentation of the information.
How To Use Data Visualization To Support Decision-Making?
Data visualization may initially appear daunting, with its charts, graphs, and other visual representations. But once mastered, it will become another powerful tool in your repertoire!
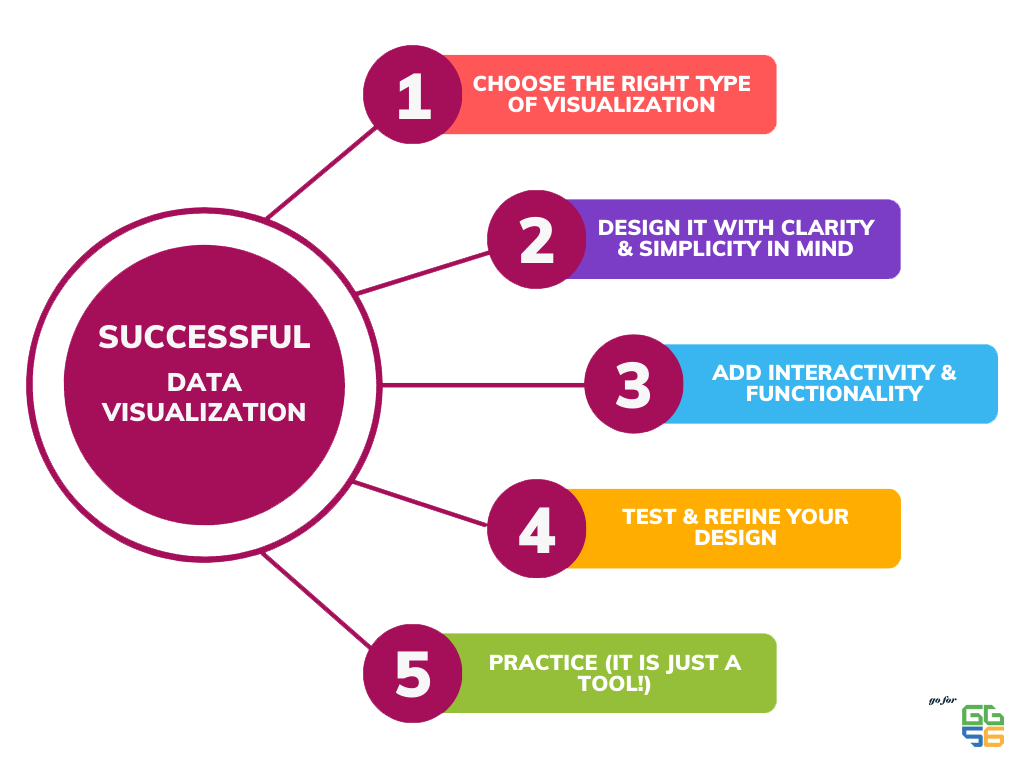
- Choose the right visualization type: Consider the nature of your data and the message you want to convey. Different visualizations excel at illustrating specific patterns or relationships. Options such as bar charts, line graphs, or heat maps each have their strengths (and weaknesses). Select the visualization that aligns best with your data and objectives.
- Prioritize clarity and simplicity in design: Aim for a clean and uncluttered design that effectively communicates your data. Keep visual elements to a minimum and prioritize clarity. Use suitable colors, fonts, and labels to guide attention and make the information easily understandable. Remember, simplicity aids comprehension.
- Add interactivity and functionality: Improve your visualization by incorporating interactive elements like tooltips, zooming features, or filtering options. Interactivity enables users to dig deeper into the data, uncover hidden insights, and tailor the visualization to their needs.
- Test and refine your visualization: Before sharing your visualization with your team, thoroughly test it to ensure accuracy, usability, and clarity. Check for any errors in the data. Gather feedback from a diverse group of users (your colleagues for instance), considering their understanding, ease of interaction, and any potential improvements. Refine your visualization based on the feedback received and voilà.

Examples Of Data Visualization
Now that you’ve learned all about the theory, let’s dive into some real-life examples of data visualization! These examples will help bring the concepts to life and show you how data can be transformed into engaging visuals. You’ll get a firsthand look at different techniques, design choices, and storytelling methods used to effectively communicate complex information and uncover meaningful insights.

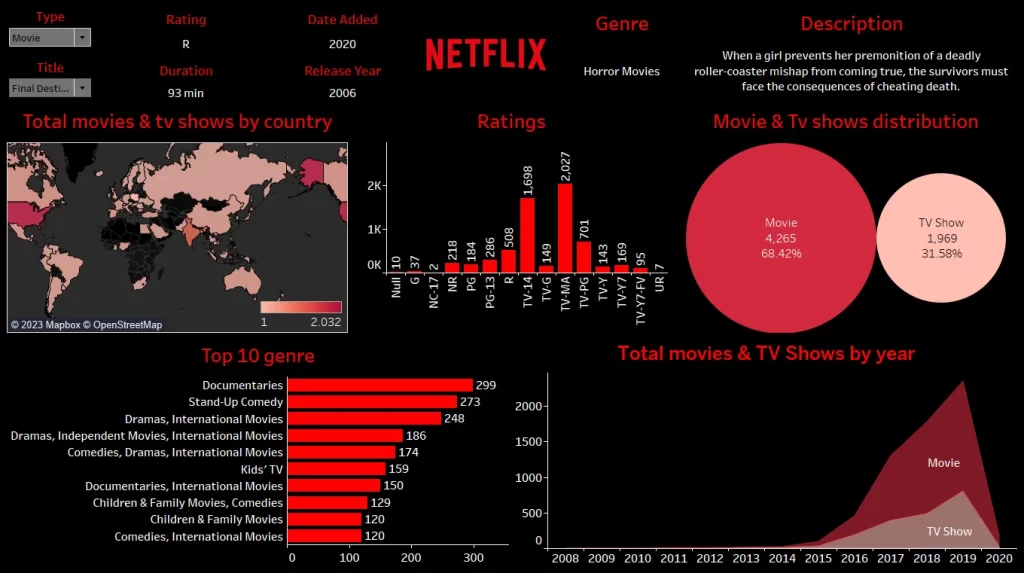
In this example, Swetapadma Das has created an immersive dashboard that offers visually appealing insights about Netflix. Using charts, graphs, and other interactive elements, users can effortlessly explore trends in genres, overall ratings, and other key aspects.

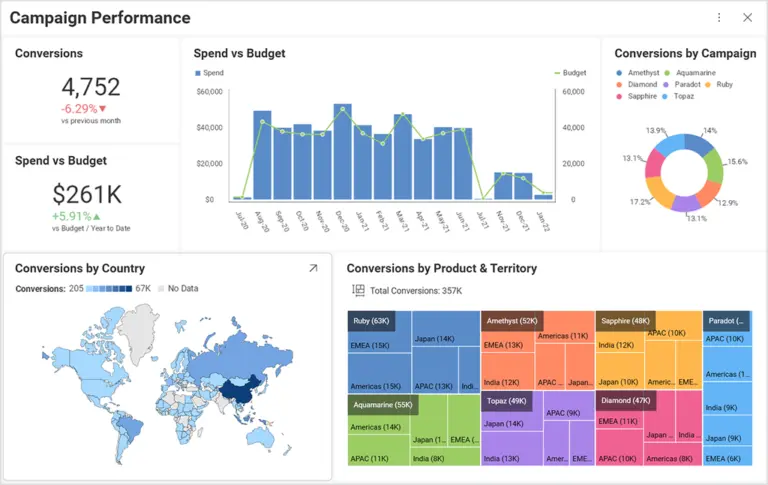
The second example is a treat for all the marketing managers out there! As you all know, marketing specialists generate a lot of data through digital marketing campaigns. Data visualization allows them to visually explore and analyze crucial marketing performance indicators, such as interactions, conversions, visits, landing page performance, website traffic, and more. The usage of charts, graphs, pie charts, and tables in these dashboards provides a clear and concise representation of complex marketing data.

Our last example is none other than our beloved FingeRate dashboard! With the power of data visualization, we have transformed complex information into visually appealing and easily digestible insights. We just couldn’t resist including it (and you are on our website, right?) in our examples!
What Are The Next Steps?
Now that you have the basics, it is time for you to dig deeper! And with internet, it has never been so easy to access courses and online classes. Here’s a list of options for you to explore:
- Coursera: It has a fantastic array of choices when it comes to learning about data visualization. Whether you’re looking for a simple course or a more immersive full-time program, they’ve got you covered!
- Tableau: While Tableau is a software, the company behind offers valuable resources for data visualization. Not only they will show you how to use their amazing software, but they will also make sure that you understand everything about the matter.
- LinkedIn Learning: Last on this list but not least, LinkedIn Learning provides a wide range of data visualization courses and tutorials. With their vast library of video-based content, you can learn at your own pace and enhance your skills in various aspects of data visualization.